

Creating Dynamic SVG Visuals in Power BI with DAX

Introduction
Have you ever wanted to elevate your Power BI reports with dynamic SVG visuals? In this edition, we’ll explore a DAX measure that generates an SVG-based representation of "Current Price," offering a visually striking way to present key metrics with precision.
This is a simple example, but it’s designed to inspire you to experiment, create your own measures, and push the boundaries of creativity in your reports.
Let’s get started! 🚀

The value we’re displaying here could be anything—Total Revenue, Expected Budget, Profit, etc. A colleague once told me about their boss who insisted on seeing the exact cents in dollar amounts, while most of us focus only on the whole number.
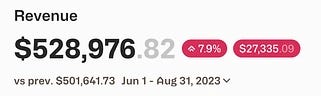
I came across a unique design on Dribbble that presented this concept in a clever way: the whole number was bold and dark, while the cents were lighter in color. Unfortunately, Power BI’s native visuals don’t offer this level of customization.
That’s where SVG comes in. With SVG, you gain full control over text size, color, and font style—allowing you to create a refined, visually appealing display.
Let’s dive in! 🚀
Here’s the code:

Breaking Down the SVG DAX Code
Let's walk through the measure and understand how it dynamically formats numbers and positions elements using SVG.
Step 1: Formatting the Number
VAR CurrentPrice = FORMAT( [Current Price], "$0.00" )The FORMAT function ensures that the value always has two decimal places, making the display consistent.
VAR DollarPart = LEFT( CurrentPrice, FIND(".", CurrentPrice) - 1 )
VAR DecimalPart = RIGHT( CurrentPrice, LEN(CurrentPrice) - FIND(".", CurrentPrice) + 1 )
Here, we extract the whole number (DollarPart) and decimal portion (DecimalPart) separately to allow precise positioning in the SVG.
Extracting the Whole Number and Decimal (Cents) from a Currency Value
The goal of this section is to separate the whole number (dollars) and the decimal part (cents) from a formatted price value (e.g., $1,234.56). This allows us to style them differently in an SVG visualization.
Breaking Down the Code:
VAR DollarPart = LEFT( CurrentPrice, FIND(".", CurrentPrice) - 1 )FIND(".", CurrentPrice):
Finds the position of the decimal point (.) in the CurrentPrice value.
LEFT(CurrentPrice, FIND(".", CurrentPrice) - 1):
Extracts everything before the decimal point, giving us just the whole number (dollar amount).
For example, if CurrentPrice = "$1,234.56", this formula extracts "1,234".
VAR DecimalPart = RIGHT( CurrentPrice, LEN(CurrentPrice) - FIND(".", CurrentPrice) + 1 )LEN(CurrentPrice):
Gets the total length of the CurrentPrice string.
FIND(".", CurrentPrice):
Locates the position of the decimal.
LEN(CurrentPrice) - FIND(".", CurrentPrice) + 1:
Calculates how many characters are after the decimal, including the decimal itself.
RIGHT(CurrentPrice, ...): Extracts the decimal point and cents (e.g., ".56").
So, if CurrentPrice = "$1,234.56", this formula extracts ".56".
Why This Matters
By separating the whole number and decimal, we can style them differently in our SVG—making the dollars bold and dark while displaying the cents in a lighter color.
Step 2: Dynamic Positioning of the Decimal
VAR BaseX = 10  -- Starting X position for the whole number
VAR CharWidth = 18  -- Approximate character width for large numbers
VAR DynamicX = BaseX + ( LEN(DollarPart) * CharWidth )
The key to dynamic alignment is calculating DynamicX, which adjusts based on the length of DollarPart. Each character in the whole number shifts the decimal part further to the right.
Step 3: Constructing the SVG
VAR SVGFormatted =
    "<svg xmlns='http://www.w3.org/2000/svg' width='300' height='50'>
        <text x='10' y='15' font-size='12' font-weight='bold' fill='blue'>Current Price</text>
        <text x='10' y='50' font-size='32' font-weight='bold' fill='black'>" & DollarPart & "</text>
        <text x='" & DynamicX & "' y='50' font-size='32' font-weight='bold' fill='lightgray'>" & DecimalPart & "</text>
    </svg>"
The
<svg>tag defines a scalable vector graphic.<text>elements display the metric label and formatted number.The decimal part is positioned dynamically for consistent alignment.
If you notice a line of code where you type in the title of what you are displaying. In this case, it is Current Price.
Another example

The example above shows how you can modify an existing KPI card. Remember you can only use the HTML visual from the Power BI appstore to have this work.
Why Use SVG in Power BI?
Scalability: SVGs remain crisp at any resolution.
Customization: You control font size, color, and positioning.
Dynamic Formatting: Adjust text positioning based on number length.
Try It Yourself!
You can embed this SVG measure into a table or card visual in Power BI using the Image URL format. Be sure to download the HTML visual from the Power BI app store to use as the visual card. Experiment with different metrics and colors to enhance your reports!
Let me know how you use SVG in your Power BI projects. Happy reporting!