

Optimizing Data Models – Best Practices for Efficient Power BI Reports

Creating efficient data models is the foundation of any effective Power BI report. A well-designed data model improves report performance, ensures accurate calculations, and simplifies maintenance. In this beginner-friendly guide, we’ll walk through the best practices for optimizing data models in Power BI step by step.

Image generated by Microsoft Copilot
Why Data Model Optimization Matters
Before diving into best practices, let’s understand why this is crucial:
Performance: Optimized models reduce load times, refresh durations, and visual calculation delays.
Accuracy: A clean and structured model minimizes errors in calculations.
Scalability: An efficient model can handle growing datasets with ease.
Step 1: Use a Star Schema Design or Waterfall Design
The star schema is a simple and effective data modeling pattern. It consists of:
Fact Table: Contains numerical metrics (e.g., sales amount, order quantity).
Dimension Tables: Contain descriptive attributes (e.g., customer name, product category).
Why Use a Star Schema?
It minimizes redundant data.
Simplifies relationships between tables.
Optimizes query performance.
How to Create a Star Schema:
Identify your fact table (e.g.,
SalesorOrders).Separate descriptive columns into dimension tables (e.g.,
Products,Customers,Dates).Use unique keys to link dimension tables to the fact table.
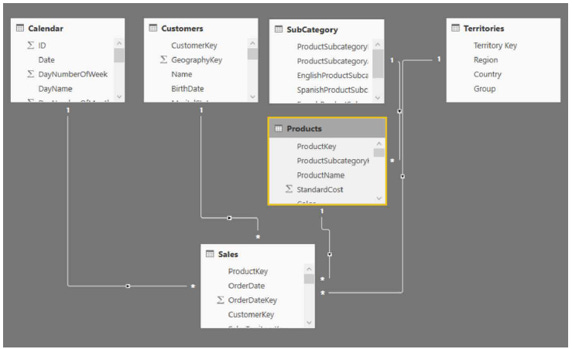
What is a Waterfall design?
A waterfall design schema is another data modeling technique. Some find it more understandable to follow the relationship data flow from Dimension Tables to the Fact Table. You have the Dimension Tables across the top of the page and your Fact Table or tables across the bottom.
Supercharge Power BI – Matt Allington
Step 2: Avoid Calculated Columns
What’s the Problem with Calculated Columns?
Calculated columns are evaluated row by row, which can increase memory usage.
Measures (calculated at runtime) are more efficient than calculated columns (stored in memory).
Alternative:
Use DAX measures for dynamic calculations.
If a column is needed, try creating it in Power Query instead of Power BI.
Example: Instead of using a calculated column for total revenue:
Total Revenue = Sales[Quantity] * Sales[Unit Price]Create a measure:
Total Revenue = SUMX(Sales, Sales[Quantity] * Sales[Unit Price])Step 3: Reduce Columns and Rows
Only load the data you need. Extra columns and rows increase the model size and processing time.
Best Practices:
Remove unnecessary columns (e.g., IDs or columns you won’t use in reports).
Filter rows during data load using Power Query.
Go to Home > Transform Data > Power Query Editor.
Apply filters to remove irrelevant data (e.g., exclude inactive products).
Pro Tip: Always disable Auto Date/Time in Power BI to avoid unnecessary hidden tables.
Step 4: Use Summarized Tables Instead of Granular Data
If you’re not reporting on transaction-level data, consider aggregating your data before loading it into Power BI.
How to Aggregate Data:
In Power Query, group data by relevant dimensions (e.g.,
Product Category,Year).Go to Transform > Group By.
Summarize metrics such as
Sales AmountorOrder Count.
Reading this section now makes me think this could be a separate topic. Perhaps another newsletter for you?
Step 5: Optimize Relationships

Efficient relationships are critical for query performance and model clarity.
Best Practices:
Create single-directional relationships unless bidirectional is absolutely necessary.
Avoid many-to-many relationships by creating bridge tables or reworking your model.
Use surrogate keys (e.g., integers) instead of text fields for relationships.
How to Check Relationships:
Go to the Model view in Power BI.
Ensure relationships are properly linked with clear cardinality.
Step 6: Use Numeric Data Types Wherever Possible
Text fields consume more memory than numeric fields. For columns like IDs, convert text to integers where feasible.
Steps to Change Data Type:
In Power Query, select the column.
Go to Transform > Data Type and select the most efficient type (e.g.,
Whole NumberorDecimal).
Step 7: Leverage Aggregations and Hierarchies
Aggregations:
Pre-aggregate data for common queries (e.g., total sales by year).
Power BI can automatically direct queries to aggregated tables.
Hierarchies:
Create hierarchies in dimension tables (e.g.,
Year > Quarter > Month).This improves user navigation and report interactivity.
How to Create a Hierarchy:
In the Model view, right-click a field in your dimension table (e.g.,
Year).Select Create Hierarchy and add related fields.
Step 8: Compress Data
Power BI uses the VertiPaq engine to compress data in memory, but you can enhance compression:
Remove unnecessary decimal precision (e.g., round
2.34659to2.35).Reduce the cardinality of text columns (e.g., abbreviate long text fields).
Steps:
Open Power Query.
Round numeric fields and truncate text columns.
Step 9: Monitor and Analyze Model Performance
Use Power BI's Performance Analyzer to identify bottlenecks.
How to Use Performance Analyzer:
Go to the View tab in Power BI.
Enable Performance Analyzer.
Run your report and review the execution times for visuals and queries.
Optimize visuals or DAX measures with long execution times.
Step 10: Documentation and Naming Conventions
A well-documented model is easier to maintain and share.
Use consistent and descriptive names for tables, columns, and measures.
Add comments to DAX measures for clarity.
Final Thoughts
By following these steps, you can create a clean, efficient, and scalable data model in Power BI. Optimized models not only improve report performance but also enhance the user experience.
If you want to learn more about Power BI best practices or need personalized coaching, DataAxe is here to help! We specialize in training and creating insightful Power BI reports for businesses of all sizes.
Want More Tips Like This? Subscribe to our weekly newsletter for just $7/month to receive Power BI tutorials, advanced DAX techniques, and tips for building dynamic and interactive reports. Let’s take your Power BI skills to the next level!
This is a simple but complete summary! Will share it with my colleagues :)