

Unlocking the Future: Predictive Analytics with DAX in Power BI

Welcome to this week’s Power BI newsletter! Today, we’re diving into a unique and powerful application of DAX measures: predictive analytics. While Power BI is renowned for visualizing historical data, we’ll explore how you can use DAX to forecast future trends—unlocking new possibilities for data-driven decision-making. Designed for intermediate to advanced users, this newsletter will guide you through practical examples, advanced techniques, and best practices.
1. Introduction
What is Predictive Analytics?
Predictive analytics uses historical data to forecast future outcomes, helping businesses anticipate sales trends, customer behavior, or operational needs. It’s a game-changer in business intelligence (BI), bridging the gap between what happened and what might happen next.
Why Power BI for Predictive Analytics?
Power BI is a go-to tool for BI professionals, but its forecasting capabilities are often underutilized. By leveraging DAX measures, you can extend Power BI beyond static reporting to deliver simple yet effective predictions—all without leaving the platform.
2. DAX Measures Overview
What Are DAX Measures?
DAX (Data Analysis Expressions) measures are custom calculations used in Power BI to aggregate or manipulate data. Common examples include summing sales, calculating year-over-year growth, or creating time-based metrics.
Why DAX for Forecasting?
While DAX isn’t a statistical programming language like R or Python, its flexibility allows you to craft custom measures for basic forecasting. This makes it a unique tool for adding predictive insights directly within your Power BI reports.
3. Predictive Analytics with DAX
Simple Forecasting with DAX
Let’s start with a straightforward technique: using a moving average to predict future values. A moving average smooths out fluctuations in historical data to reveal trends, which can then be extended as a forecast.
Example: Moving Average for Sales Forecasting
Imagine you want to forecast next month’s sales based on the past three months. Here’s a DAX measure to calculate a 3-month moving average:

How It Works: This measure averages the TotalSales column over the last three months, updating dynamically as new data is added.
Application: Use it to predict the next month’s sales based on the trend.
4. Advanced Forecasting Techniques
Linear Regression in DAX
For a more sophisticated approach, you can implement linear regression in DAX to predict future values based on a straight-line trend. This involves calculating the slope and intercept of a regression line.
Step-by-Step Guide
Here’s a simplified DAX measure for linear regression forecasting (assuming a table with Sales[TotalSales] and Date[MonthNumber]):

Explanation:
Slope and Intercept define the regression line.
The measure predicts the next month’s sales (CurrentX + 1) based on historical trends.
Note: This is a basic implementation; real-world use may require additional refinement.
5. Visualizing Forecasts in Power BI
Creating Forecast Visuals
Use a line chart to display both historical data and forecasted values:
Plot Sales[TotalSales] for past months.
Add your ThreeMonthMovingAvg or ForecastSales measure for future periods.
Use distinct colors (e.g., blue for historical, red for forecast) to differentiate.
Tips for Effective Visualization
Add a tooltip to show forecast confidence or assumptions.
Include a reference line for the current date to separate past and future.
6. Limitations and Best Practices
Constraints of DAX for Predictive Analytics
Scale: DAX struggles with large datasets or complex iterative calculations.
Precision: It lacks built-in statistical functions for advanced modeling.
When to Use Other Tools
For intricate forecasts (e.g., exponential smoothing, ARIMA), consider integrating Power BI with Azure Machine Learning or Python scripts.
Data Quality and Assumptions
Accurate forecasts depend on clean, consistent data. Validate your assumptions (e.g., linear trends) to ensure reliability.
7. Conclusion
Predictive analytics with DAX opens a new frontier in Power BI, enabling you to forecast trends without external tools. From simple moving averages to linear regression, these techniques can enhance your reports with actionable insights. Experiment with these ideas in your own projects, and let us know how they transform your BI workflows!
8. Resources for Further Learning
Sidebar: Performance Optimization Tips
Filter Early: Use CALCULATE with specific filters to reduce data processed.
Avoid Overcomplexity: Break complex measures into smaller, reusable steps.
Test with Small Data: Validate your measures before scaling up.
Case Study: Optimizing Inventory with DAX
Company X used a DAX moving average to forecast demand, reducing excess inventory by 15% and saving $50,000 annually. Simple, yet impactful!
Detailed Exploration of DAX Measures for Predictive Analytics
Scenario Setup
Assume you have a dataset with two tables:
Sales: Contains TotalSales (numeric) and DateKey (foreign key to Date table).
Date: Contains Date, MonthNumber (e.g., 1 for Jan 2023, 2 for Feb 2023, etc.), and other time dimensions.
The goal is to predict future sales using DAX measures within Power BI.
1. Moving Average for Forecasting
Concept
A moving average smooths historical data to reveal trends, which can be extended as a forecast. It’s simple yet effective for short-term predictions.
Detailed Example: 3-Month Moving Average
This measure calculates the average sales over the last three months and can be used to estimate the next month’s value.
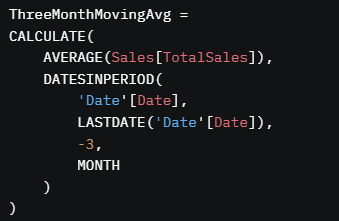
Breakdown
AVERAGE(Sales[TotalSales]): Computes the mean of sales values.
DATESINPERIOD('Date'[Date], LASTDATE('Date'[Date]), -3, MONTH): Filters the Date table to include only the last three months, ending with the most recent date in the current context.
CALCULATE: Applies the filter to the aggregation.
Extending for Forecast
To explicitly forecast the next month, create a separate measure assuming the trend continues:
Logic: If the current date is the latest in the dataset, return the moving average as the forecast; otherwise, return BLANK() to avoid cluttering historical visuals.
Practical Use
Data: Sales of $10,000 (Jan), $12,000 (Feb), $15,000 (Mar).
Result: ThreeMonthMovingAvg for Mar = ($10,000 + $12,000 + $15,000) / 3 = $12,333. Forecast for Apr = $12,333.
2. Linear Regression for Forecasting
Concept
Linear regression fits a straight line through historical data (e.g., sales over time) to predict future values. It calculates a slope and intercept using the least squares method.
Detailed Example: Linear Regression Forecast
Here’s a more detailed DAX measure to predict next month’s sales based on a linear trend:
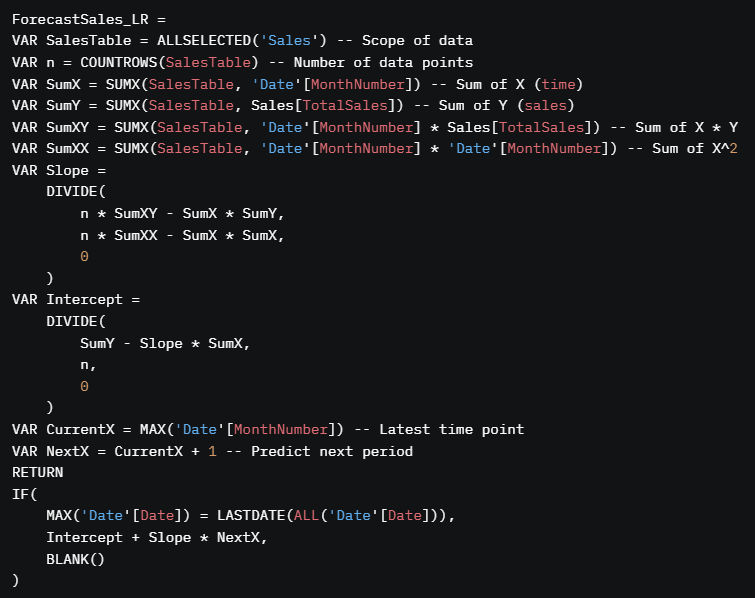
Breakdown
ALLSELECTED('Sales'): Ensures the measure respects slicer/filter selections while accessing all rows for calculation.
Variables:
n: Number of periods (e.g., months).
SumX, SumY: Sums of time and sales.
SumXY, SumXX: Components for slope calculation.
Slope: (n * ΣXY - ΣX * ΣY) / (n * ΣXX - (ΣX)^2) — Standard linear regression formula.
Intercept: (ΣY - Slope * ΣX) / n — Y-intercept of the line.
NextX: Predicts one period ahead.
IF: Displays the forecast only for the next period.
Practical Use
Data:
Month 1: $10,000
Month 2: $12,000
Month 3: $15,000
Calculation:
n = 3
SumX = 1 + 2 + 3 = 6
SumY = 10,000 + 12,000 + 15,000 = 37,000
SumXY = (1 * 10,000) + (2 * 12,000) + (3 * 15,000) = 79,000
SumXX = 1^2 + 2^2 + 3^2 = 14
Slope = (3 * 79,000 - 6 * 37,000) / (3 * 14 - 6^2) = 2,500
Intercept = (37,000 - 2,500 * 6) / 3 = 7,333.33
Forecast for Month 4: 7,333.33 + 2,500 * 4 = 17,333.33.
3. Additional Example: Weighted Moving Average
Concept
A weighted moving average assigns more importance to recent data, improving forecast accuracy for trending datasets.
DAX Measure

Breakdown
DATEDIFF: Calculates the distance in months from each date to the latest date.
SWITCH: Assigns weights (3, 2, 1) based on recency.
Normalization: Divides by the sum of weights (6).
Practical Use
Data: $10,000 (Jan), $12,000 (Feb), $15,000 (Mar).
Result: [(1 * 10,000) + (2 * 12,000) + (3 * 15,000)] / 6 = (10,000 + 24,000 + 45,000) / 6 = $13,166.67.
Forecast for Apr: $13,166.67 (weighted toward recent growth).
4. Implementation Tips
Performance Optimization
Use VAR to store intermediate calculations, reducing redundant computations.
Limit the scope with ALLSELECTED or specific filters to avoid processing unnecessary rows.
Visualizing Results
Create a table with Date[Month], Sales[TotalSales], and your forecast measures.
Use a line chart: Historical sales in blue, forecasts in red, with a vertical line at the current date.
Validation
Compare forecasts to actuals (if available) to assess accuracy.
Adjust weights or periods based on your data’s seasonality or trends.
5. Why This is Unique
Most Power BI tutorials focus on descriptive analytics (e.g., sums, averages). Extending DAX to predictive analytics—especially with linear regression—offers a novel approach that leverages Power BI’s native capabilities, avoiding the need for external tools in simple scenarios.